The entire human race seems to be developing very well: the Internet economy, the Olympic Games, rocket launches, and space roaming...
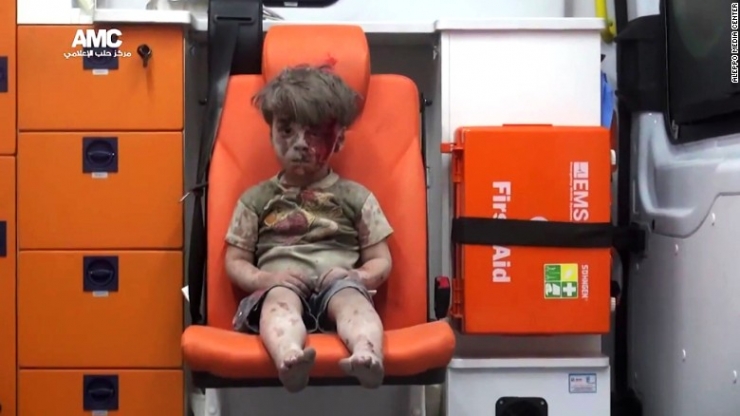
However, such a prosperous picture is not the whole of humanity. The world is still full of poverty and war. Like the five-year-old boy Omran Daqneesh who had just suffered an air raid in the war in Syria, surprisingly quiet, numb and vacant, he wiped the blood off his face without crying, and who knows how cruel he has been!
People are happy to share happiness and affluence. It is difficult for us to know the daily and living standards of war-torn and poor people. Although there are so many international organizations claiming to go to help and change, it is difficult to prescribe the right medicine because they cannot understand the basic information.
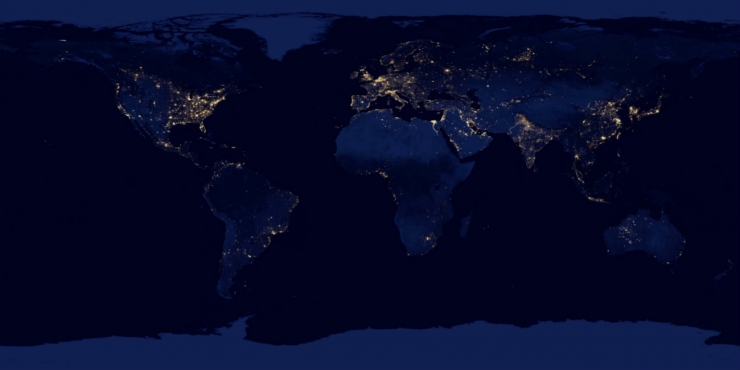
Their night has no lightFor a long time, researchers have an indicator of the extent of development in a region: the brightness and density of night lights. But this method has a limitation, that is, it can only see the bright areas, and for those dark places of the night, we can only judge that they are generally poor, and to what extent poverty is not known.
“The poorest places in Africa are our most concerned. But at night, almost all of them are dark places,†said Neal Jean, Ph.D. in Electrical Engineering and Computer Science at Stanford University.
Two villages, one near the lake and one near the forest, may be completely dark in the light distribution map, but they are close to different natural resources and have different levels of wealth.
Moreover, in general, understanding the economic level of a region requires research. This method cannot be carried out in war-torn and conflict areas. It happens that these areas are the poorest places in the world.
Why should I know where is the poorest?International organizations and local government policy makers care most about these data. For example, if a non-profit international organization wants to provide financial assistance to underdeveloped areas, the funds are limited. They need to know exactly which areas have the most earnest requirements, and the so-called “paying the moneyâ€.
For policy makers, understanding the economic development situation in each region of the country is a must-do work, because it can only develop targeted development plans. But what is the truth? According to World Bank data, in the decade of 2000-20010, 39 out of 59 African countries had conducted only less than two surveys of poverty levels .
New ways: smarter and cheaperStanford’s team of researchers led by Jean, they took the machine learning algorithm of the now very popular convolutional neural network, the data used is divided into day and night, the daytime data comes from the satellite shot of the Earth HD image. The data at night is the light distribution map.
The entire algorithm is in two steps. The first step was called Transfer Learning. The researchers “fed†the data from day and night in five countries, including the five African countries of Nigeria, Tanzania, Uganda, Malawi, and Rwanda. The computer needs to learn about the relationship between objects on satellite photos and the brightness of night lights.
For example, the system can learn: a lake area and a forest. They should be dark at night. This is not related to whether or not the area is poor; however, a village where the houses are gathered should have higher brightness at night if the area is dark. , then it is very likely that the poor areas.
Through such learning, the system extracts data from poor areas. Next, the second step is called the Ridge Regression Model. Researchers once again "feed" the system with data from real surveys, such as the World Bank's Living Standards Survey.
This time, the system will predict the general level of poverty in areas that have not been surveyed. For example, the system already knows the approximate nighttime brightness of village A in 10 houses, and the survey report has information about 10 villages B that are similar in geographical location to village A and have similar light levels. The report shows the household income of village B. The level is $1.9/day. Then the system can determine that A village and B village have similar economic levels through cross-contrast.
The two-step algorithm system is more accurate than a single method that relies on light prediction. In a specific experiment, the accuracy rate is 81%-99%.
In addition, since the system uses data from public institutions, such as satellite imagery and light distribution maps from NASA, and the survey reports come from the U.S. government and international organizations, the entire system is inexpensive and can be used for The public and institutions use it for free.
Jean said that the current data of the system is only from five countries in Africa. The next step is to train with data from other countries to map the global poverty map and help the government and institutions to better alleviate world poverty.
Via Spectrum
Extended reading:
The phone you use may be stained with blood from African workers
Prejudice and discrimination in computer systems: In addition to killing, there are other ways