2015
The last working day of the year. Zhang Fu, a student from Fudan University, conducted tests using our company's human IL-24 ELISA kit. The experiment was successfully completed. Liu, another student from the same lab, was introduced to our sales manager yesterday and is preparing to test with the IL-24 ELISA kit as well. We hope that in case of any technical issues during the process, our team will be available to provide immediate support. We also analyzed the steps for drawing and producing the ELISA kit standard curve. First of all, I would like to express my sincere gratitude to Fudan University for their continued support. Many reagent tests involve challenges related to the standard curve. The quality of the standard curve directly affects the accuracy of experimental results and even the success or failure of the entire experiment. So, how should we draw or create a standard curve? Here are several key points to consider when setting up a standard curve: 1. The concentration of your samples and other parameters are calculated based on the standard curve, so it's crucial to treat the standard curve as more important than the main experiment itself. Without a reliable standard curve, you cannot properly interpret your results. 2. When setting the concentration range for your standard curve, ensure it has a wide span and covers the expected concentration range of your test samples. Ideally, the sample concentration should fall within the upper and lower limits of the standard curve. For an S-shaped curve, aim to place the experimental sample in the steepest part of the curve, where it appears almost linear. 3. It's better to use a serial dilution method to prepare the standard concentrations. This helps avoid large deviations between different concentrations and ensures consistency. 4. When testing standard samples, always run them in increasing order of concentration. This reduces the risk of high concentrations affecting low concentrations and improves overall accuracy. 5. A standard curve typically consists of at least 5 points, though 7 is ideal. More data points lead to a more accurate curve. 6. The correlation coefficient (R) of the standard curve depends on the experiment’s requirements. Generally, R should be above 0.98. For some experiments, aiming for 0.99 or even 0.999 is recommended.
Shanghai Jinma is launching new products. During this period, we have been promoting our popular ELISA kits. Teachers and researchers are welcome to place orders. If you come to our company and order common ELISA kits during the product launch, you’ll receive a 40% discount. The more you buy, the more you save—don’t miss out!

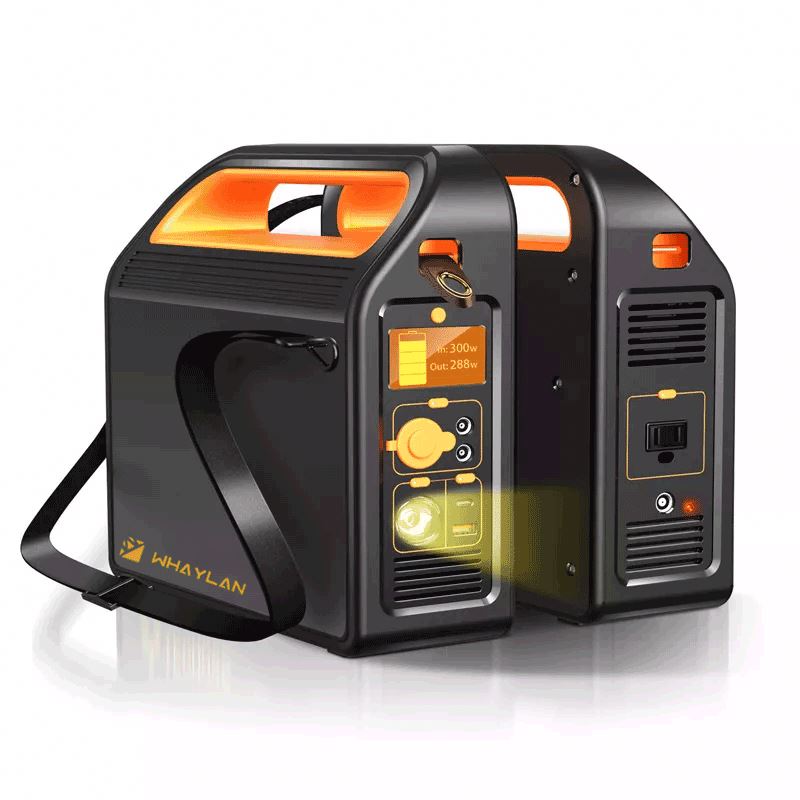
Whaylan 600W portale power stations have Large capacity, high endurance, a variety of ports, at any time for your need to charge the equipment. Completely say goodbye to the anxiety of outdoor electricity and devote yourself to an outdoor activity. At the same time, it can be equipped with solar panels to charge the power supply. The energy storage technology of lithium battery is combined with the clean renewable energy of solar energy to truly realize the enjoyment from day to night.
600W power station,solar station,bluetti 600w,lithium generator
suzhou whaylan new energy technology co., ltd , https://www.xinlingvideo.com